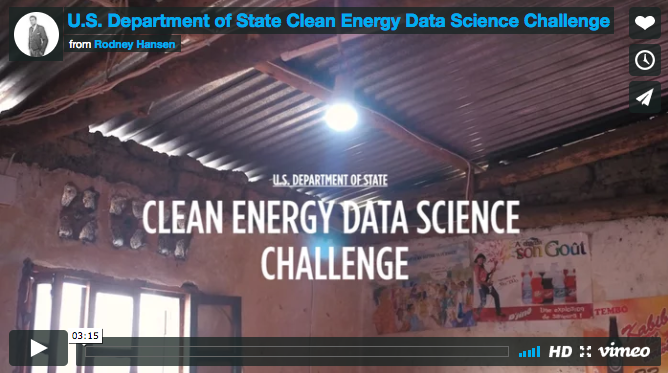
This project is a response to the U.S. Department of State’s Clean Energy Data Science Challenge, co-hosted by Booz Allen Hamilton, the World Bank and Galvanize in San Francisco in April of 2017. Over the course of 48 hours, a team of seven data scientists and hackers put together a data product that helps impact investors identify promising markets for solar microgrid development in Myanmar. Here’s the scoop:
“Over 1 billion people around the world lack access to electricity and another billion lack access to reliable electricity. Providing access to energy can enable progress across the education, health, social, and economic sectors. Innovative and scalable solutions are needed to meet the drastically rising demand for electricity across the developing world, as well as the urgent imperative to significantly reduce global carbon emissions. One of the primary challenges is a lack of adequate financing for distributed energy projects — particularly from the private sector. A leading barrier to stimulating private finance is often a lack of access to reliable, real-time data and analysis about the country’s renewable energy development potential. Companies and developers are also be hesitant to do business in countries that don’t have or provide information necessary for identifying renewable energy sites. They may be unable to afford conducting assessments themselves. And current methods for assessments, when conducted, can take months or years to assess where to complete.”
-Zvika Krieger, US State Department
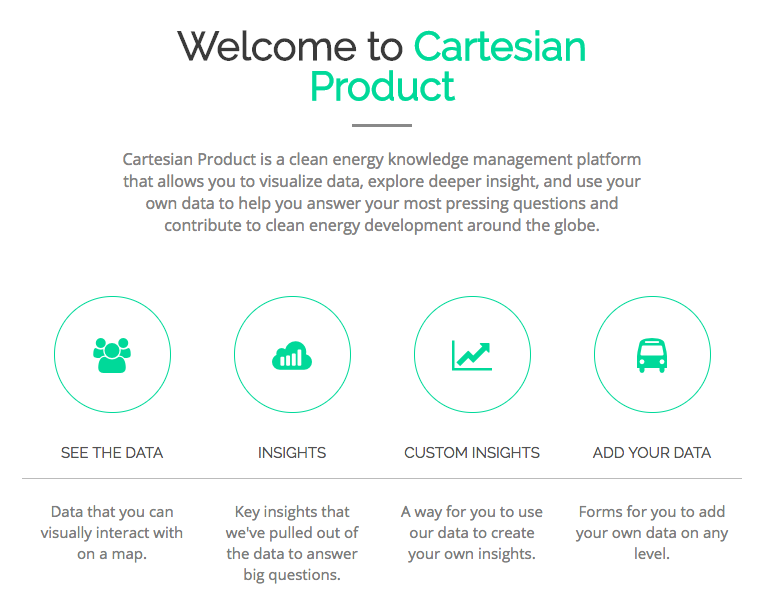
Product
Cartesian Product is a clean energy knowledge management platform that enables a diverse set of users to identify high-potential emerging energy markets. Beyond being a static ad-hoc analysis, the site includes a backend that lets researchers and surveyors contribute their own data to the platform. The vision was to crowd-source the collection of ground-truth data to domain experts: enabling future machine learning solutions to predict risk, reward, and social + environmental ROI.
We aggregated and distilled a diverse set of survey and geospatial data to derive metrics that answer the following questions:
- Where are the regions with high photovoltaic (PV) potential?
- Which townships are dense and affluent enough to be able to afford microgrid systems?
- Where is the preexisting electricity grid likely to expand?
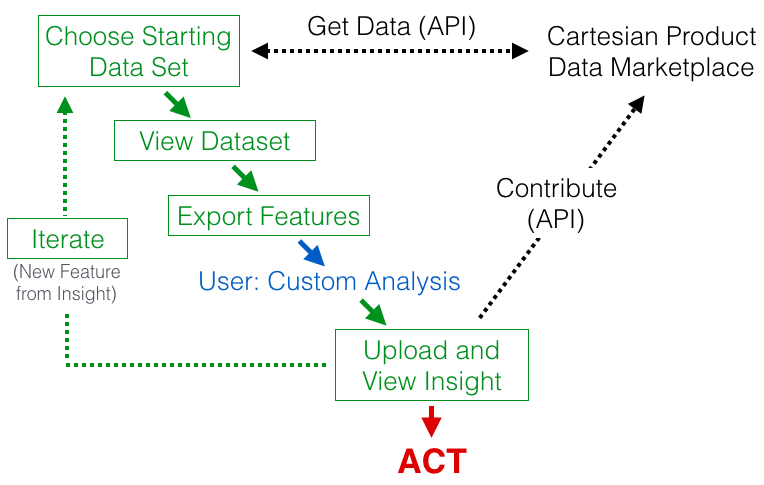
Workflow:
This is a adaptable solution for any data beyond Myanmar(Burma). But this is the overall process:
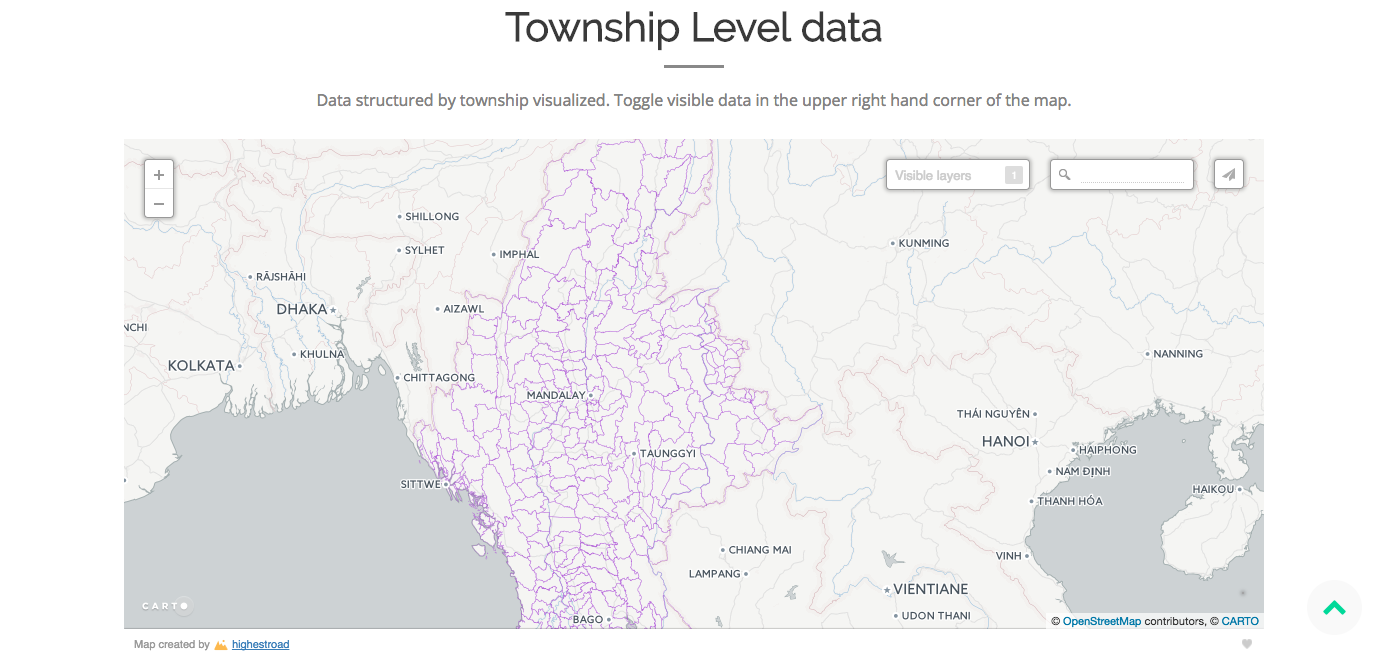
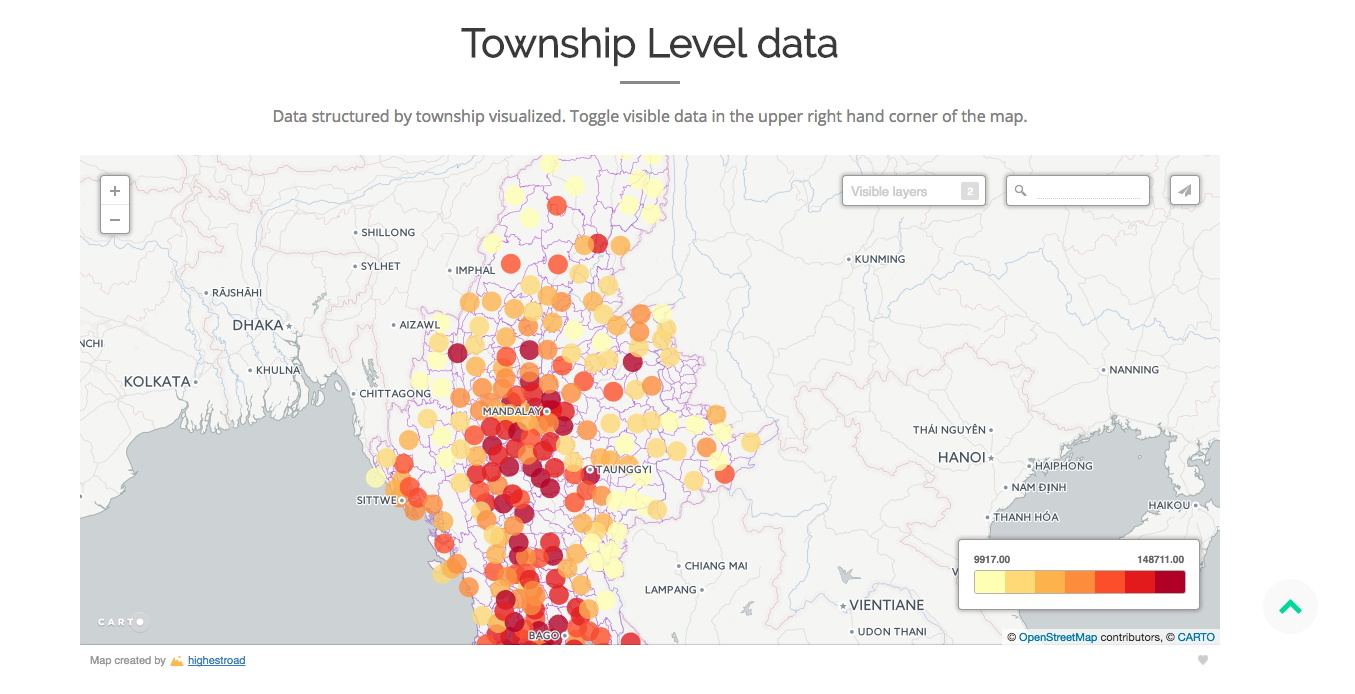
After the data is uploaded, you can look it at a Township level. This can easily be changed to zip codes.
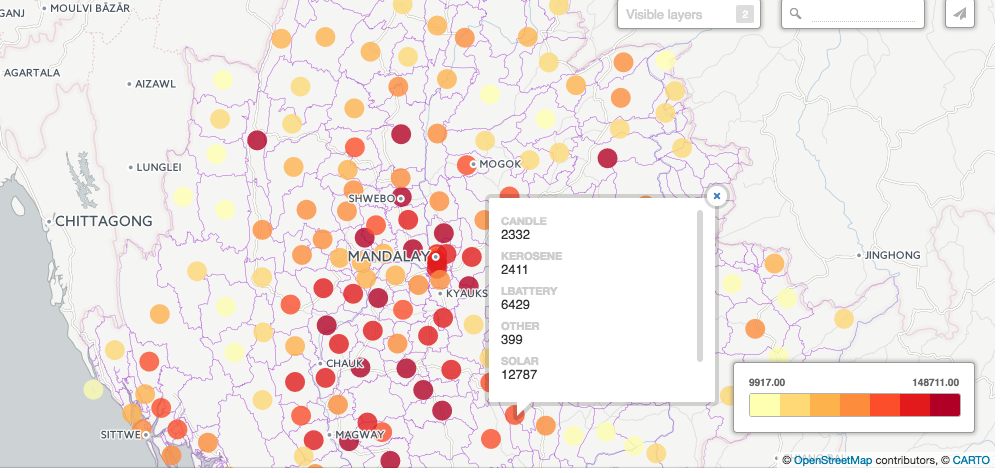
You can also look at subgroups as well. For example, if you choose power source from the data menu you can click on a dot (colored by total power sources surveyed in a township) , you can view a breakdown of power source.
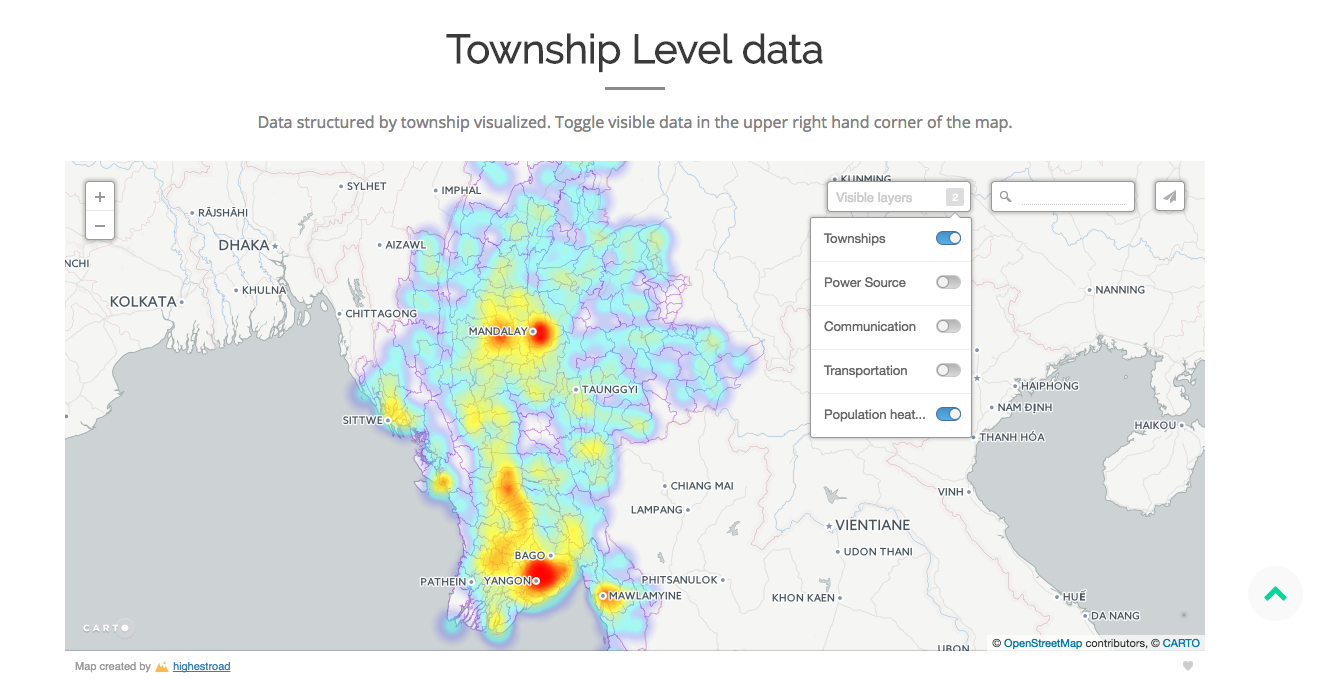
You can also use a heatmap by selecting data you want to display:
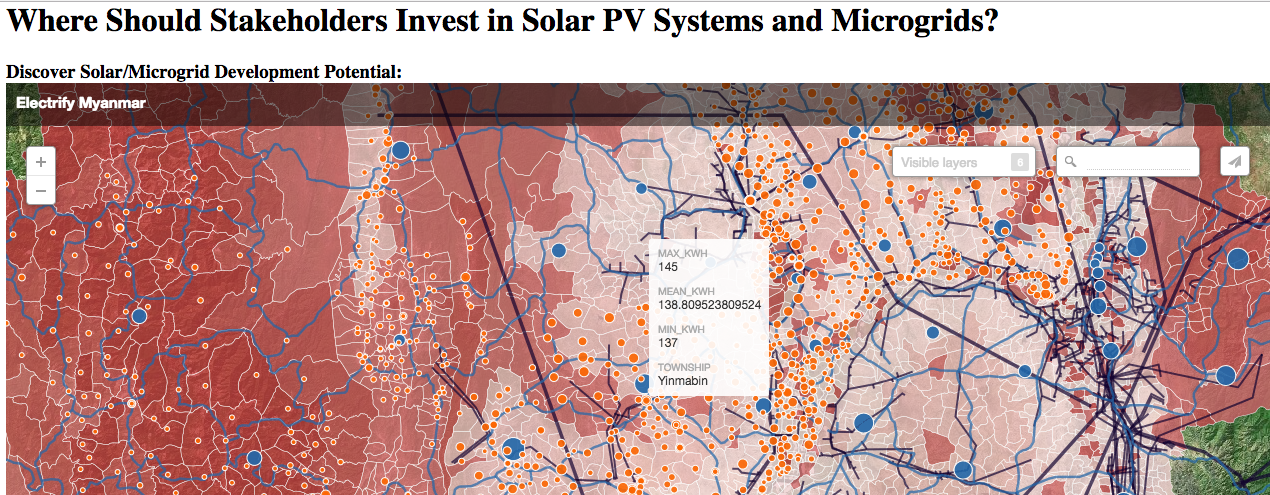
You can also check the Microgrid data and the distances to a power line, the closer it is to a power line the bigger the circle
You can also look at energy potential. Shaded areas have higher potential as opposed to the lighter areas.
Links:
Landing Page to our main site:
Solar Potential for the Country:
Main Grid Plan Layout:
Contributors
CAMERON KRUSE - Young Explorer
VICTOR GARCIA- Data Scientist
MEHMET TURANALP - Software Engineer
LUKMAAN BAWAZER - Data Scientist
ANTHONY ABERCROMBIE - Geospatial Data Scientist
ZACHARY THOMAS - Data Scientist
JASON CHIANG - Data Scientist
BAOLIN LIU - Data Scientist